




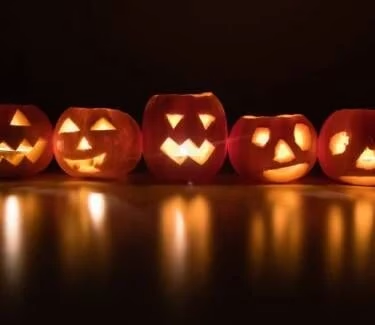
More than half of U.S. consumers (56%) plan to celebrate Halloween this year, according to newly released survey data from Numerator.
More than 80% of respondents said they plan to buy candy, making it the top item on Halloween shopping lists, and over half said they will go to big-box retailers for their purchases. Private-label candy also ranked among the top brands across generations, says Supermarket News, which reported on Numerator’s findings.


Participation is highest among younger consumers, particularly members of Generation Z and millennials, with 71% saying they plan to celebrate.
The findings provide a snapshot of consumer spending patterns and preferences ahead of the holiday, highlighting generational trends in candy choices, shopping habits and attitudes toward ingredient transparency.
Among Numerator’s key findings:
- Decorating homes (56%) and handing out candy (56%) are the most common ways people plan to celebrate. Decorating is especially popular among Boomers+ (60%) and residents in the Northeast (62%).
- Among those celebrating, 81% plan to purchase candy. Decorations (49%), food (44%), costumes or apparel (39%) and alcoholic beverages (21%) followed.
- Types of candy: Chocolate is the preferred choice for 78% of those handing out treats, followed by fruity or sour candies (52%). About 36% plan to distribute other types of sweets.
- Nonfood alternatives: Roughly 17% of celebrators plan to give out small toys or trinkets, such as stickers or glow sticks. Members of Gen Z and millennials are 1.5 times more likely than older generations to choose these alternatives, with 28% indicating such plans.
- Label preferences: One in four consumers said they avoid candy with artificial colors or dyes, while 37% reported little concern about those ingredients.
- Shopping preferences: Most shoppers (62%) plan to buy Halloween items in stores, compared with 11% who expect to shop primarily online. Big-box retailers are the most popular destinations (61%), followed by grocery stores (43%), discount or dollar stores (38%) and online retailers (32%).
- Spending outlook: Half of respondents said they expect to spend about the same on Halloween this year as last year. Nineteen percent anticipate spending more, while 22% plan to spend less.
- Tariff concerns: Half of celebrators expect tariffs to affect their Halloween shopping. Twenty percent anticipate significant effects, 17% expect a moderate impact and 13% foresee a slight one.